Friday, March 24, 2017
Breaking The Myth About Volume

IS VOLUME A LEADING INDICATOR?
If you wait for the volume to increase, you are actually getting in late. It is not a leading indicator, it’s not a leading indication. It’s not a leading anything. It’s often late to the party. So I’m getting in before the big volume comes in. the big volume is great but see you would really have to suffer through this move against your position, against these lows, psychologically that can be very challenging to deal with.
If we have another obvious surge of volume as in A12 bar. And what is that? Well the market’s actually coming down. That occurs on this red long tail bearish bar. So we’ve got this level of volume in there. It finally breaks out above that. But it breaks down, or it breaks out on a red bar, while the market’s coming down. And so that would almost make one think, well maybe some big short selling is coming in. No, that’s not at all what happened. In fact it didn’t move down much beyond that at all.
And then the next obvious big surge in volume comes in on another bar. Again late to the party. Not early at the cycle low. Not even at the break out. And so it occurs in about the middle of the move. Hardly a leading indication. And so that’s the second thing wrong with that statement is it is not leading at all.
It’s not a calculation. So first of all calling volume an indicator is wrong.
Number 2, it is not leading. It is actually often lagging. So let’s take a couple of looks at that. And I’ll explain to you why it’s lagging. Especially today.Volume is just what it is. The number of shares in the stock market or lots, or contracts, or forex, or futures that are traded. So it’s not an indicator it is actual fact. So it’s not a derivative of anything.
Here’s an illustration of what I was talking about before, for exhaustion patterns when doing stock market volume analysis. Here’s an exhaustion pattern after 11 Peak, market gap down.
We get a nice sound exhaustion pattern candle stick at A12, big volume coming in. now again some people would say, oh that could be a beginning of a new up move. And I said, no it can just go sideways, here it does.
It goes sideways for a while and this is a daily chart, so 1, 2, 3, 4 5, 6, 7, 8, 9, 10, 11, 12, almost about 2 weeks actually. Little more than 2 weeks actually, because these are trading days. So just consolidates for over 2 weeks, and then it goes down a little bit more.
Just because you get in exhaustion pattern type volume, that’s not in and of itself a good reason to take a reversal trade, or in this case to buy. So let’s finish up talking about why this is happening. Why this is true, why it’s so counterintuitive. And why it’s against traditional teaching.
The reason is actually very simple. Volume as a leading indicator just is NOT even accurate. It doesn’t work. It’s not reliable. And the reason is, hold on to your hats.
The primary reason, the big picture is that the big institutions, the big players, pension plans, everybody’s trading this huge money. They don’t want to be trapped. And they know that if they come in with huge orders, everybody in the world looks down there and they can see that volume histogram and they are going to use that. They say, "Oh the big boys are coming in." They don’t want you to know when they are coming in. so they do a couple of things.
One thing they do is they come in through various means. In other words, they are not going to just buy, in this case 'Disney', they are going to come in through various markets, through various exchanges, through different financial instruments. The other thing, and they might do it overtime with accumulation.
THE WORLD OF "DARK POOLS"
The other thing though that a lot of people are NOT aware is dark pools. What are dark pools?
Dark pools are non-exchange trading in the markets. So it’s basically institutional investors who want to buy or sell huge, maybe a million shares of a stock. They don’t want you to see that. So they actually will go to a dark pool. Which is basically private exchanges or forums, for trading stocks.
It’s not a public stock exchange. So the volume, that they are trading, they are trading it but it won’t show up down here on your volume histogram. And by the way they are a big deal. This is not something that’s just occurring on a small scale.
In fact if you did a little research on this, at Investopedia it said that in 2014, Non-exchange trading in the US accounted for about 40% of all US stock trades. 40% !. So how can you rely on volume when 40% of the volume, and that by the way, 40% is not the little guy. That 40% are the big institutions. The pros, the whales, the smart money, the big pension funds, the hedge funds. The smart money is not showing up here my friends. And that’s why volume is very deceiving, not only it isn’t reliable, looking stock market volume analysis can actually be very deceiving !
Monday, January 9, 2017
January 6- Breakout Buy in EMini S&P Futures


The EMini S&P futures had a breakout setup for Friday, which made sense in light of the monthly employment report due today. The breakout setup gave a good trade for the day session after a fake out in the premarket.
Thursday’s bar for the S&P was an inside day, NR4 and a doji. These were all patterns indicative of a market lacking in conviction, which would be logical ahead of the monthly employment report. In keeping with the lack of directional clues, I approach breakout days willing to take a trade in either direction- let the market decide which way it wants to go, we go along for the ride. ( In this morning Exclusive Advisory I noted ROC was bullish- something to give confidence for the long side.)
For today’s trade, our upside breakout reference prices were the Thursday high of 2266.00 and the Wednesday high of 2267.25 – we would look go to long if the market traded above these price(s).
I suggest waiting for the 8:30 stock market open to take trades and today was a good example why. After the 7:30 employment report there were two moves above the Thursday high (double top at 2266.75) however this move lacked momentum and the market fell to a new session low of 2258.25.
This session low was made just after the 8:30 however it too lacked momentum, and the rally resumed. Around 9 AM it reached the Thursday high and 45 minutes later it began to move above the highs. Although they were all close, at this point I would use the premarket or Wednesday high as the reference price for an entry point, in order to have confidence in the uptrend.
The initial stop loss for our longs could go either below 2261.00 (the last swing low) or the session low. By 11 AM it reached the previous contract high at 2273.00, eventually making an intraday double top high of 2277.00.
Saturday, January 7, 2017
January 6 – Taylor Trading Sell Short Day in T Bond Futures


Treasury Bond futures had a big rally on Thursday as they rallied out of Wednesday’s breakout pattern. This gave them a Taylor Trading Technique Sell Short day signal for Friday
Treasuries (Bonds, the 5 and 10 Year T Notes as well) had a breakout pattern Wednesday. They all showed range contraction from Tuesday as well as a Doji Bar, which indicate a lack of participation and lack of commitment to buying higher or selling lower, which would be needed to create a daily trend.
Breakout setups are often resolved by a big directional move in the following session, as traders decide on a direction, which pulls in more trade interest, setting up a positive feedback loop. That’s what we saw in Treasuries Thursday – they opened near the low of the range and rallied over the session, ending with a close near the daily high.
In the session following a breakout move I normally anticipate a Taylor Trading move in the opposite direction, so in this case Thursday’s breakout rally meant we would anticipate a Taylor Trading Sell Short day for Thursday. We look for a Sell Short day because the breakout rally of the previous day tends to create an “excess high” (to use the Market Profile term) that ends up marking a top and a trend change down.
The Taylor Trading Sell Short day tells us to look for a failed rally above the previous day high (the “reference price”) with the move back under the reference price being our signal for a short sale. Thus, for March T Bond futures we would watch 153-00 as our reference price today.
Bonds did have a rally and a sell signal before the employment report. I don’t like to take trades into major reports so I passed on this trade. My thought is that the result of a report tends to be a 50 / 50 proposition, and I’d like to take trades where I think I have better odds than that. Additionally, a report like NFP often causes the kind of “excess moves” we look for, and looking for trades after a report allows us to exploit other traders’ mistakes.
The initial move after the NFP was a rally back above our reference price and then the session high (153-05) to make a new high of 153-09. This rally failed as well and the subsequent drop back below either today’s lower high or the Thursday high could be used as a signal for a short sale.
The initial stop loss would go above today’s high of 153-09. We would hold shorts only when the market shows downside momentum and a new high would negate the bearish trend.
Bonds sold off in the wake of the employment report, making a series of lower highs to make a session low of 151-29around 8 AM (This was just above Fibonacci retracement support at 151-28). This low held until 9:40 when stocks finally rallied above their Thursday high (S&P futures have a breakout setup for today.
Thursday, December 15, 2016
December 14 – Post-FOMC Emini S&P Trade


For the EMini S&P futures, we were anticipating a breakout trade after the 1 PM announcement. In a advisory I sent out around 12:30 I suggested we watch the session low of 2265.25 as our reference price for a downside breakout. As it turned out, this level was a 50% retracement of the past two days range so a break below there would likely lead to a move to Monday’s low.
The break actually took some time to get going; the first move was up with the down move beginning about five minutes later. The first break of our reference price came around 1:10 PM, triggering our first short sale signal.
The market made a short covering rally into the start of Yellen’s press conference, leading to a test of our reference price level, leading to a test of our reference price level.
“Support becomes resistance” proved an accurate axiom as it was unable to hold above the reference level, turning back down to make a session low of 2248.00. It held over two tests of the Monday low, ending with a close in the middle of the post- FOMC range.
Wednesday, November 30, 2016
How to Read Bull and Bear Market Phases - Accumulation, Participation & Distribution
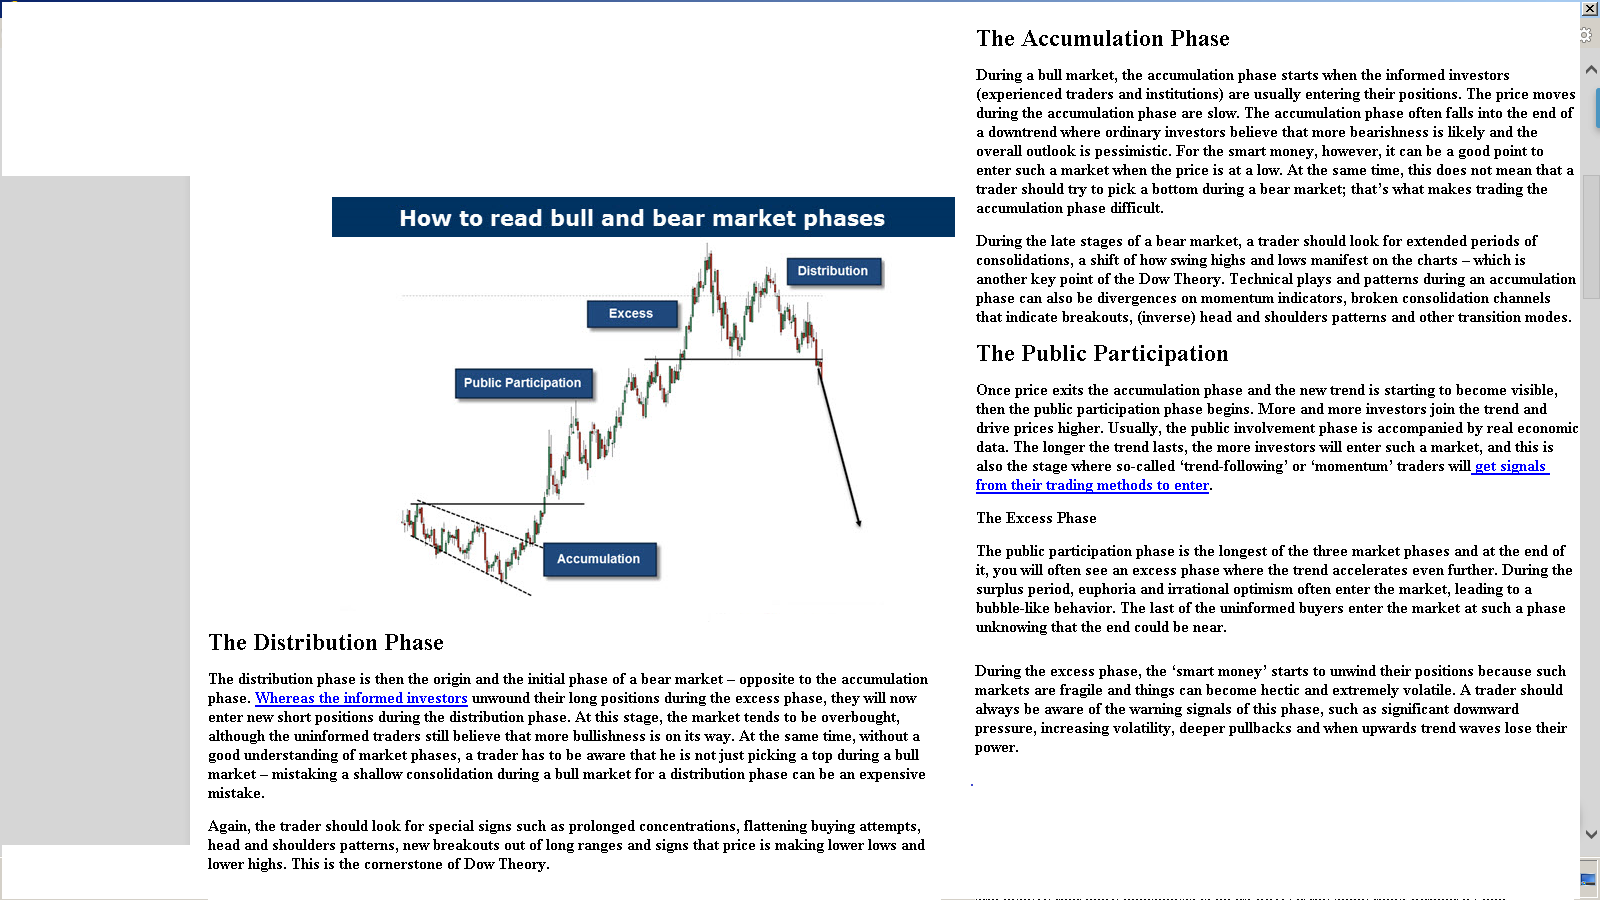
Dow Theory is a cornerstone of price analysis and its principles have been time-tested over decades. An understanding of the three market phases and the trend cycle concepts within the Dow Theory can help traders make sense of the way price moves and shed new light on how bull and bear markets are created.
The Dow theory distinguishes between the accumulation phase, which is where the ‘smart money’ starts to accumulate positions very early on, and the public participation phase where the trend has become apparent to the ‘typical investor’ and retail traders. The third distribution phase is the final stage where the market tops and the smart money is unwinding their positions while the average investor is usually still adding to their positions. Let’s now take a closer look at the individual trend phases and what is important to know here.
Tuesday, November 29, 2016
November 28- Taylor Trading Sell Short Day in EMini S&P Futures
For the EMini S&P futures, Friday was a breakout buy day. On Friday it opened near the session low, rallied above the previous session high and continued higher, closing near the top of the daily range.
In reaction to this, we anticipated a Taylor Trading Sell Short day for Monday. For a TTT Sell Short day we look for the market to open near the session high, (possibly) make a failed attempt to rally above the previous day high and then proceed to sell off over the course of the session, finally closing near the daily low.
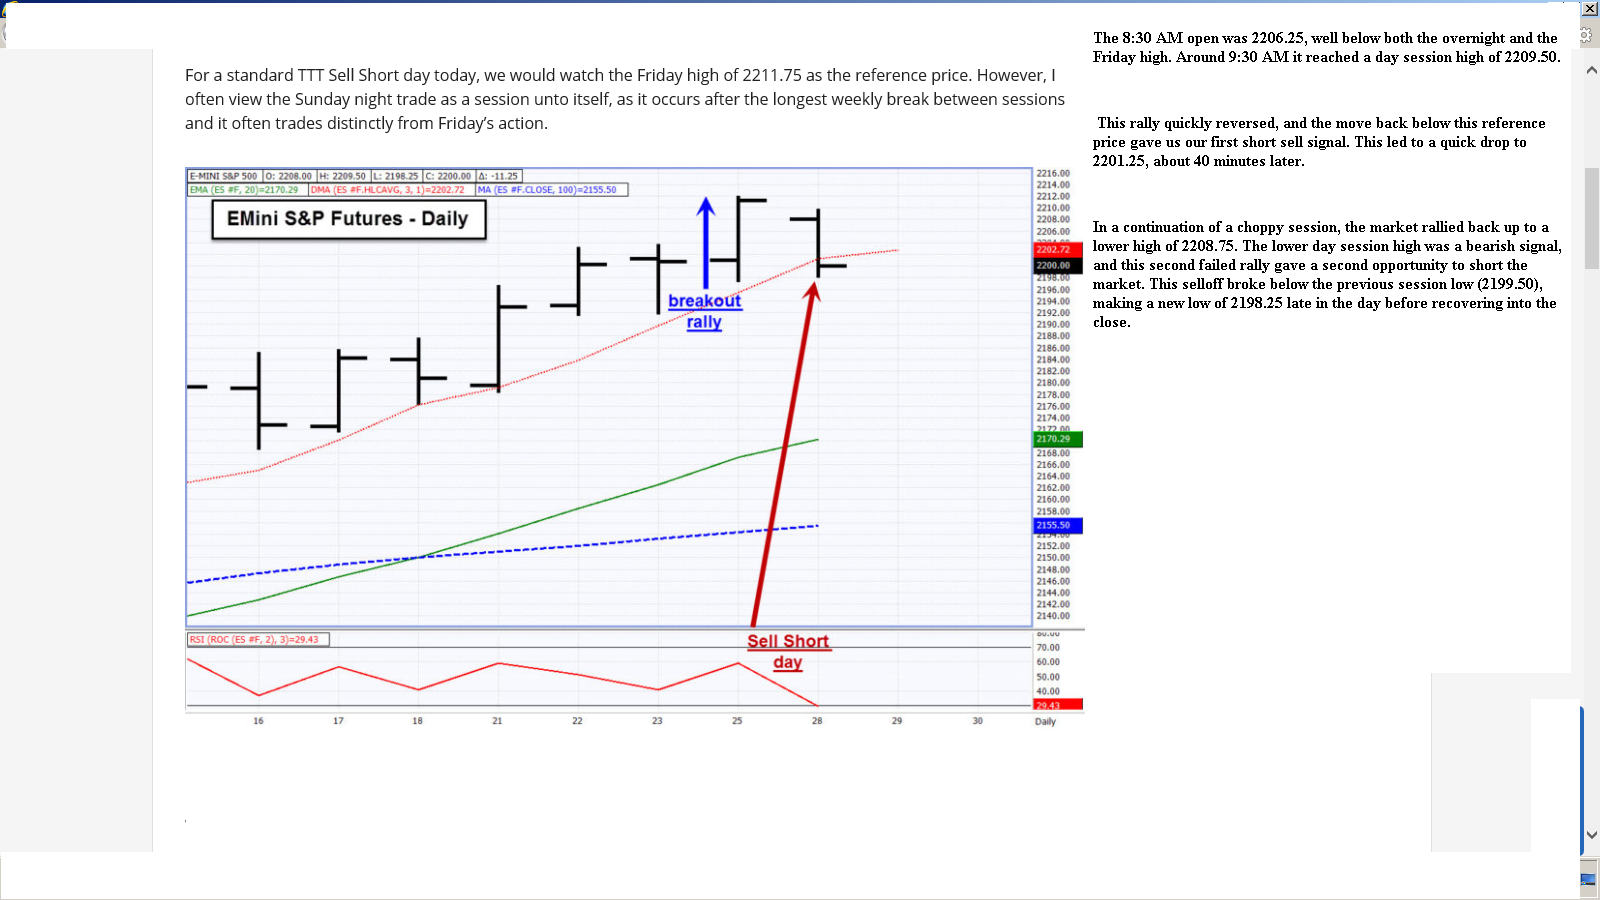
For a standard TTT Sell Short day today, we would watch the Friday high of 2211.75 as the reference price. However, I often view the Sunday night trade as a session unto itself, as it occurs after the longest weekly break between sessions and it often trades distinctly from Friday’s action
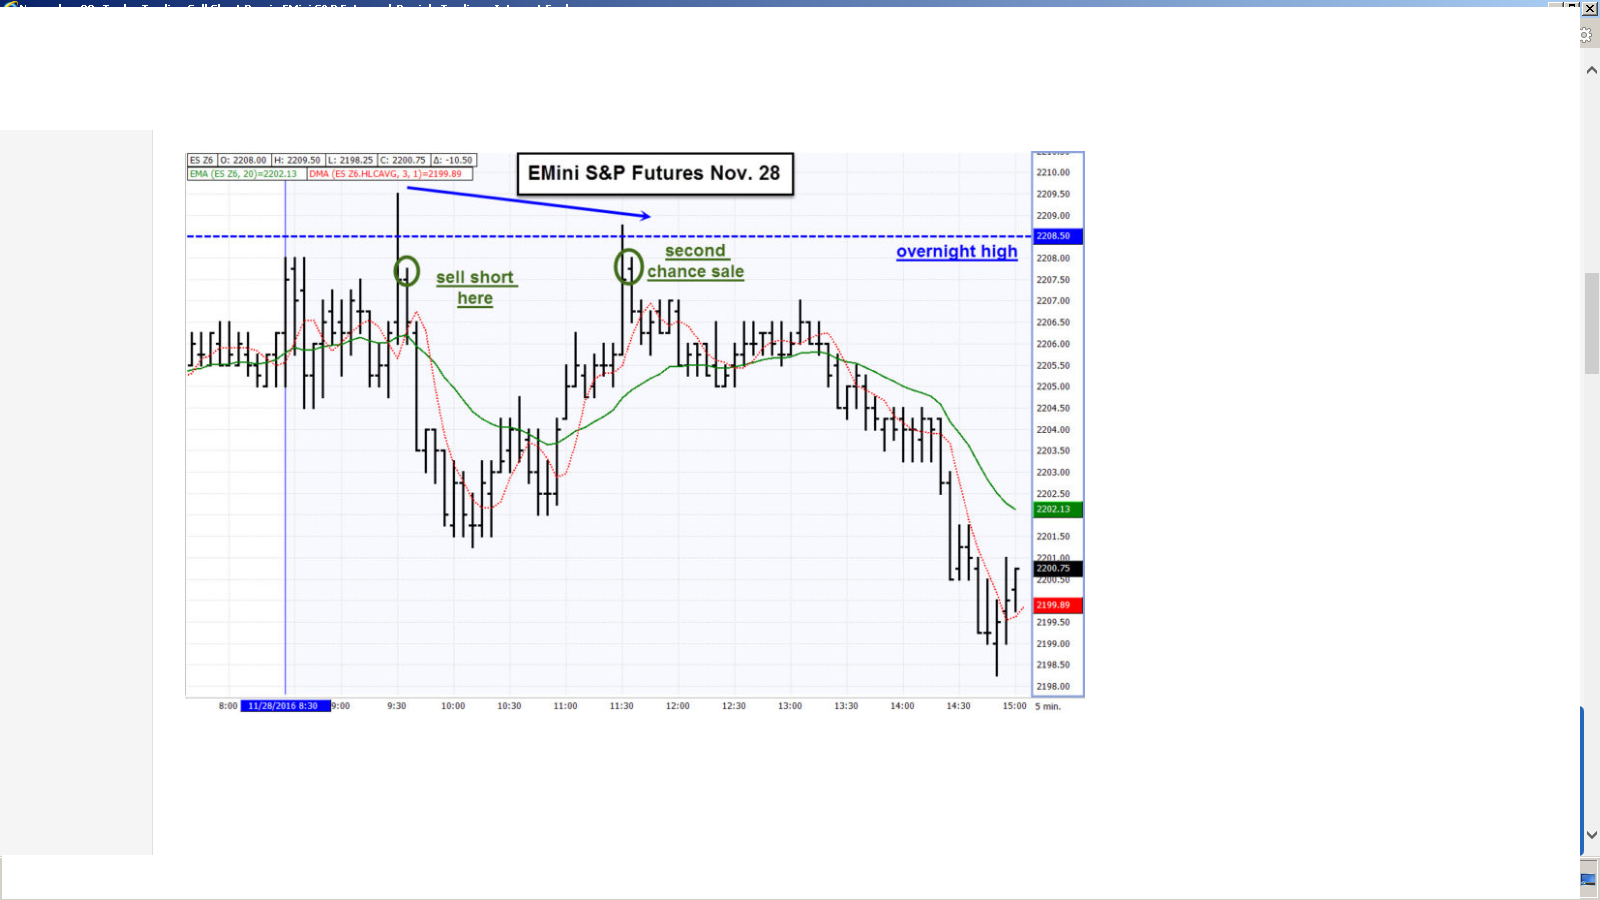
It was for this reason ( Sunday as a separate trading session) that when we would write this morning’s Trade Recommendation to my exclusive subscribers where I suggested we use the overnight high (2208.50) as a lower reference price for the Sell Short day. If the market was unable to reach Friday’s high, the high from Sunday night could be a good reference price level for deciding whether we could look for a Sell Short day / failed rally trade setup.
Subscribe to:
Posts (Atom)