Weekly Long Term Picture looks sideways and the fundamentals look very uncertain.
It is a traders market and Buy and Hold does not apply.
Beware !
Weekly Long Term Picture looks sideways and the fundamentals look very uncertain.
It is a traders market and Buy and Hold does not apply.
Beware !

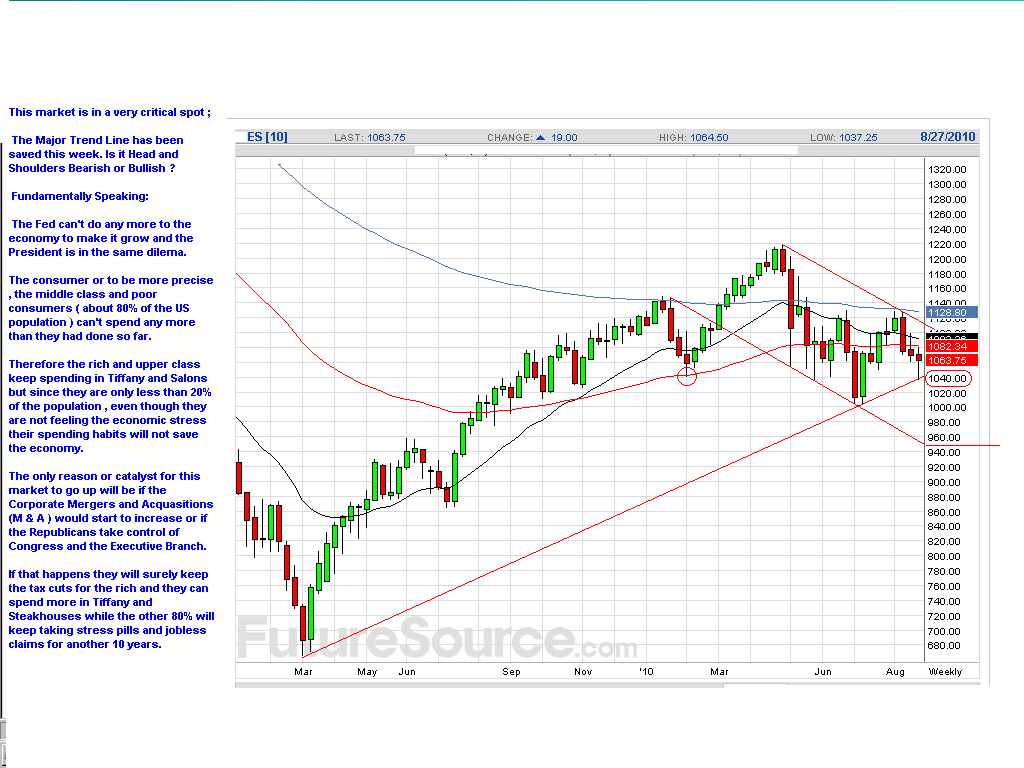
The Long Term Trend Line from the March Low held on friday and now the 1040 Level becomes the major Line In the Sand between Bulls and Bears.
The Clue was in the 20-Day Low:
The fact that new NYSE 20-day lows declined despite the S&P trading 0.7% below last Tuesday’s low indicated we would see a close back over Wed 1054.50 close by next Tuesday at the latest.
Typically you’ll see an expansion of new 20-day NYSE lows when the SPX trades below the previous day’s low given that this is a much more sensitive measure than the 52-week high/low data. When this doesn’t occur, it’s a supportive sign for stocks, and the S&P has a strong record of posting a subsequently higher close within the next four sessions. Of the last 30 occurrences, all 30 led to a higher SPX close (above the setup day’s close) within four days… It worked again this time.
During the Globex session on Sunday if any retracement occurres it will find support at 1054.25, which is Friday's I B High and with the confluence of the previous VAH 1055.50. This 1054 level is also the 38.2 Fibonacci retracement from Friday's High. You can Bank on it !
Monday , August 30th
As predicted above the market retraced back to 1054.75 that is only two ticks from 1054.25 ( Prev I B High ) and is also the 50% Fibonacci retracement from Globex High. The 1055 is the Pivot. Sold 1055 in the 6th Hour . That was the Line In the Sand. The target is 1010
Position was exited during the Globex session for a 10 pts profit.
Tuesday - August 31
BUY Stop 1054.25 . Filled Long 1054.25 - Open Position + 27.50 Pts
Setup : N R 6 and Doji
Wednesday September 1st : Long from 1054.25


